Using Datadog with Mergify
Send your merge queue metrics to Datadog to build dashboards, alerts, and reports alongside the rest of your observability data.

The Datadog integration pushes your merge queue metrics into your own Datadog account. Everything on the merge queue statistics page is available as a Datadog metric, so you can graph queue health next to your own service metrics and alert on it.
The integration is official and ships as a Mergify tile in Datadog’s integration catalog. Mergify writes the metrics to Datadog for you. There is no agent to install and nothing to run in your CI.
Prerequisites
Section titled Prerequisites-
A Datadog account, and permission to authorize integrations in it.
-
On the Mergify side, a plan that includes the Datadog integration, plus the GitHub organization
Ownerrole or the Integrations Admin delegated role.
Setting up the integration
Section titled Setting up the integration-
In the Mergify dashboard, go to
Integrations → Datadog. Installing the Mergify tile from Datadog’s integration catalog and clicking Connect Accounts lands in the same place.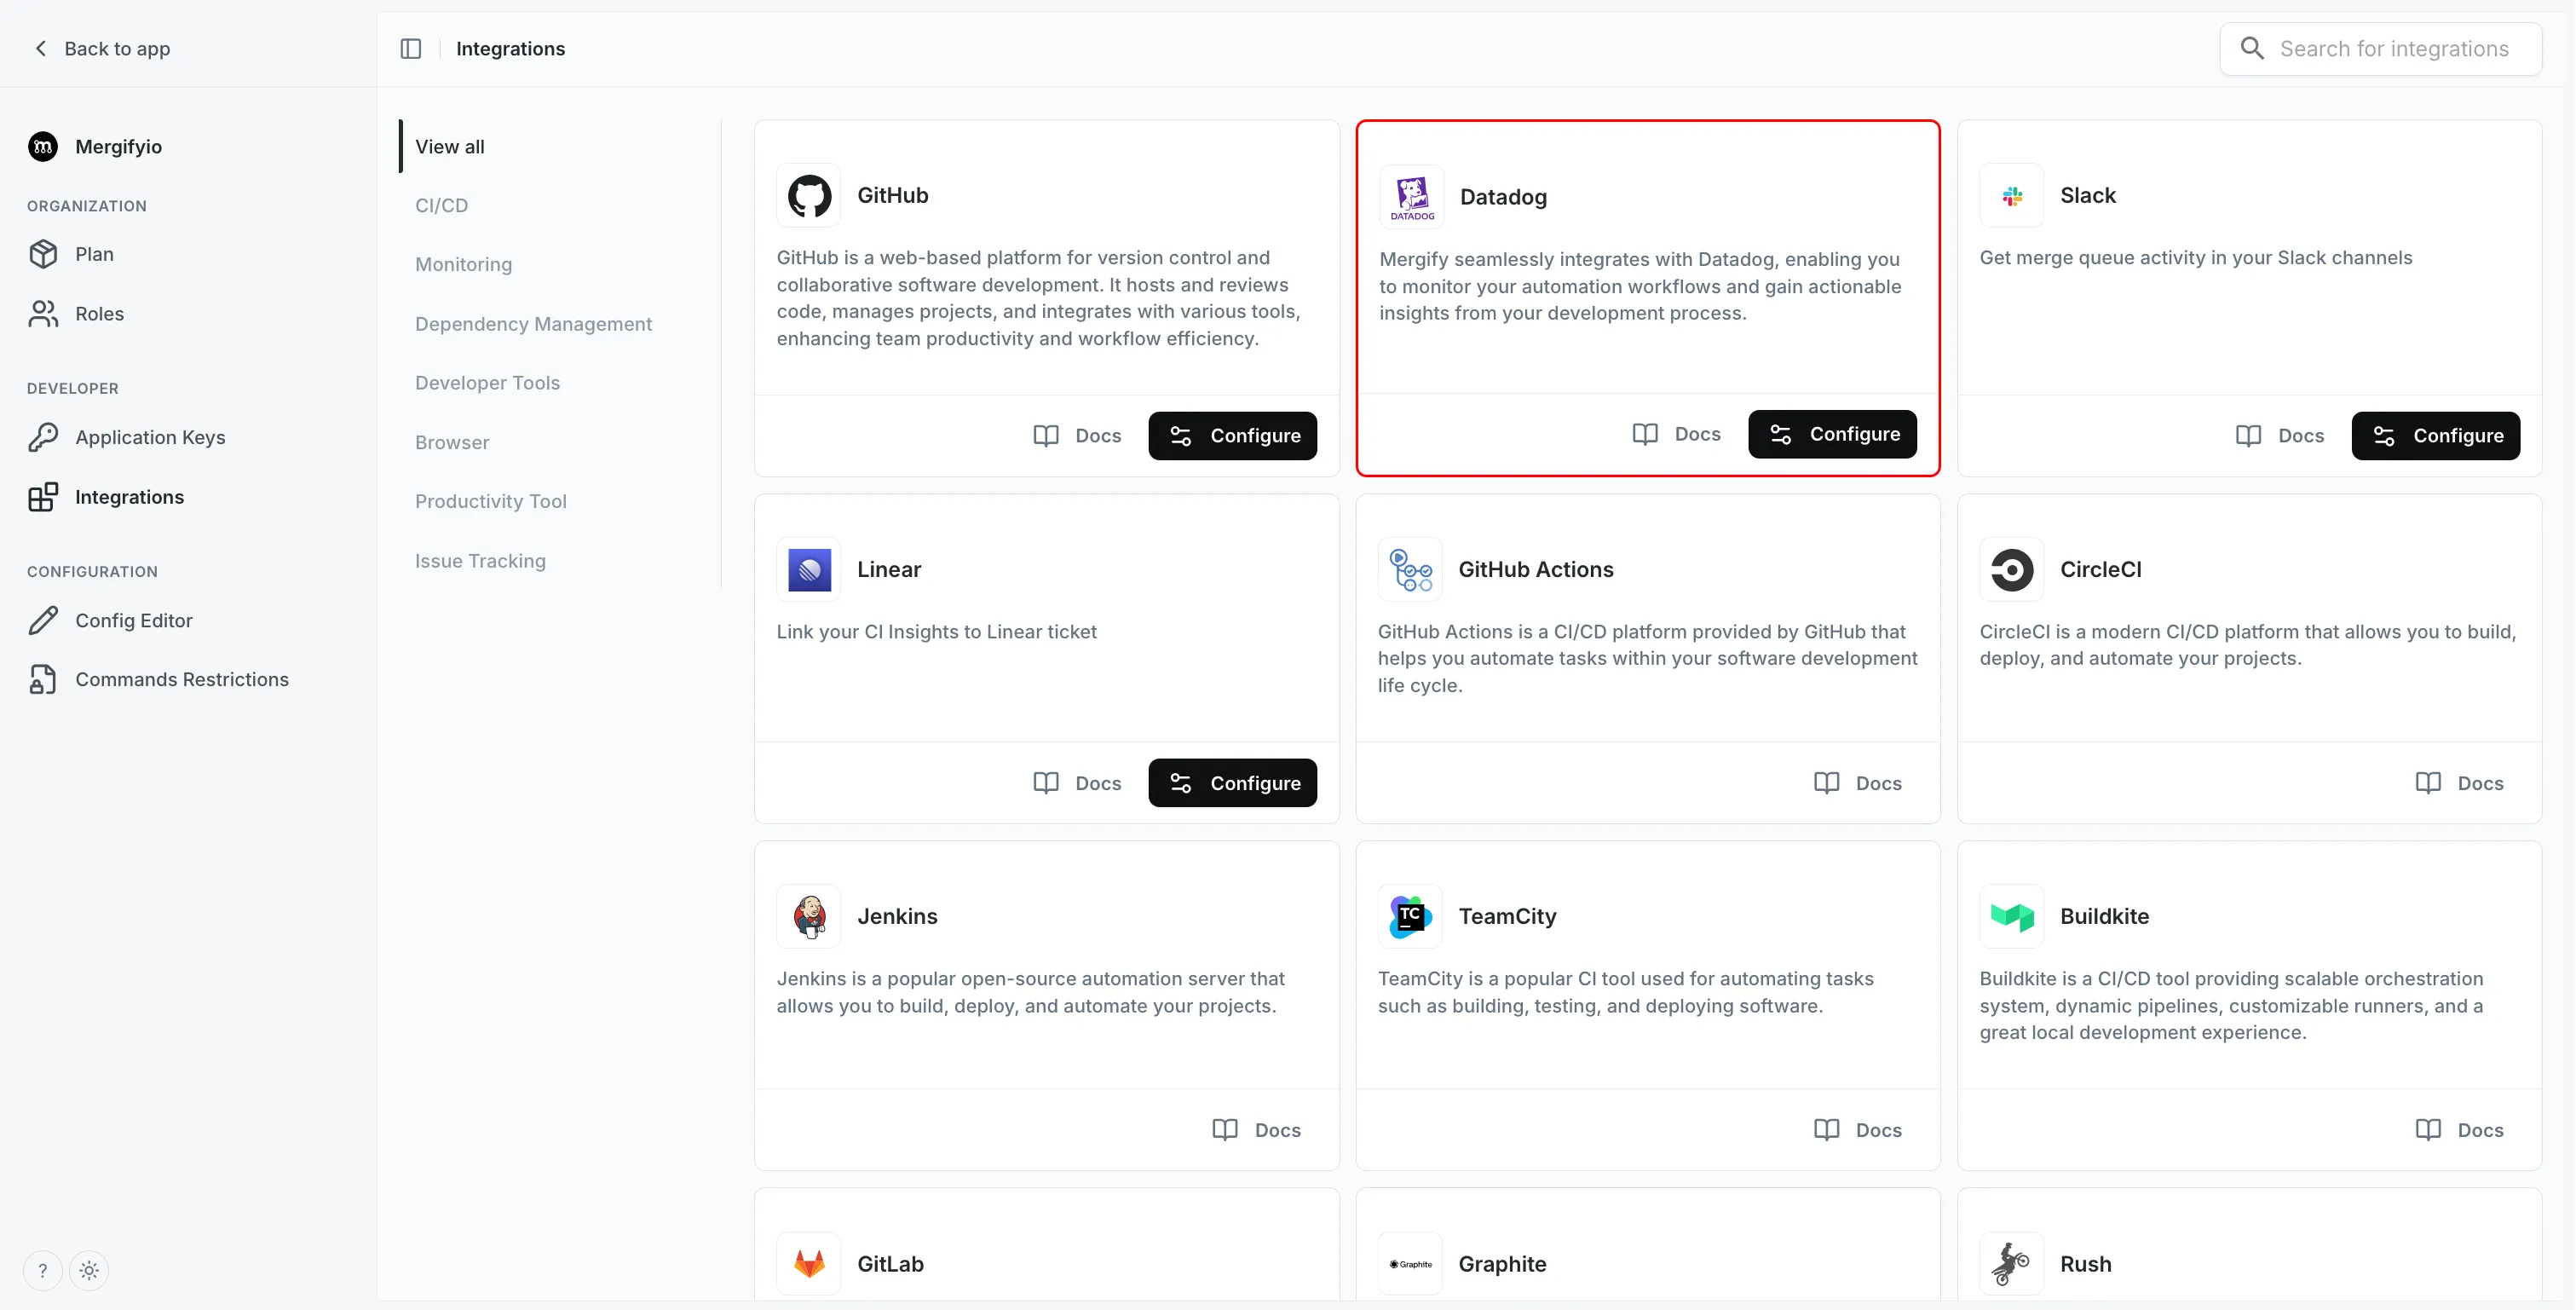
-
Connect your Datadog account. Pick the Datadog site your organization uses (US1, US3, US5, EU1, US1-FED, or AP1), then authorize Mergify. Mergify creates an API key scoped to the integration and starts pushing metrics to that site.
-
Choose what to monitor. For each repository, select the merge queue base branches you want metrics for: the branches your queued pull requests target, such as
mainor a release branch.
Metrics
Section titled MetricsEvery metric is published every 5 minutes, and each point covers the 5-minute window it represents.
Every metric carries these tags:
| Tag | Description |
|---|---|
repository | Full repository name, such as octo/hello-world |
branch | The base branch the queued pull requests target |
queue | Name of the queue rule |
priority_rule | Name of the matching priority rule, when set |
Reference
Section titled ReferenceMetrics submitted as count are event tallies that Datadog sums exactly over any time range. Metrics submitted as gauge are peak values within the window.
| Metric | Type | Description |
|---|---|---|
mergify.queue.entered | count | Pull requests that entered the queue |
mergify.queue.merged | count | Pull requests merged out of the queue |
mergify.queue.exit_reason | count | Pull requests that left the queue, tagged with exit_reason |
mergify.queue.size.max | gauge | Largest the queue got |
mergify.queue.running_checks.max | gauge | Most checks running at once |
mergify.queue.check_outcome | count | Finished queue checks, tagged with outcome |
mergify.queue.checks_retries.recovered | count | Failed checks that passed on retry |
mergify.queue.checks_retries.not_recovered | count | Failed checks that failed again on retry |
mergify.queue.bisection.started | count | Batch bisections started |
mergify.queue.total_queue_time.sum | count | Total time queued, in seconds |
mergify.queue.total_queue_time.count | count | Queue sessions the sum covers |
mergify.queue.ci_runtime.sum | count | Total CI runtime, in seconds |
mergify.queue.ci_runtime.count | count | CI runs the sum covers |
mergify.queue.batch_size.sum | count | Total pull requests across batches |
mergify.queue.batch_size.count | count | Batches the sum covers |
mergify.queue.breakdown.ci_runtime.sum | count | Queued time spent running CI, in seconds |
mergify.queue.idle.capacity.sum | count | Queued time spent waiting for capacity, in seconds |
mergify.queue.idle.schedule.sum | count | Queued time spent waiting for a schedule, in seconds |
mergify.queue.idle.freeze.sum | count | Queued time waiting on a freeze, in seconds |
mergify.queue.idle.count | count | Queue sessions the breakdown sums cover |
Both outcome and exit_reason are success when the pull request merged or
its checks passed. Otherwise they name the reason the pull request left the
queue or its checks were aborted, such as checks_failed or pr_dequeued. The
integration’s README
lists every value.
Querying the metrics
Section titled Querying the metricsAverages
Section titled AveragesThe duration and size metrics ship as a .sum and a .count rather than a
pre-computed average, so Datadog can recompute the real average over whatever
time range you graph. Divide a family’s own sum by its own count:
sum:mergify.queue.total_queue_time.sum{$repository} / sum:mergify.queue.total_queue_time.count{$repository}The same shape gives you average CI runtime (mergify.queue.ci_runtime.*) and
average batch size (mergify.queue.batch_size.*).
Check retry recovery rate
Section titled Check retry recovery rateThe share of failed checks that passed when retried:
sum:mergify.queue.checks_retries.recovered{$repository} / (sum:mergify.queue.checks_retries.recovered{$repository} + sum:mergify.queue.checks_retries.not_recovered{$repository})Where queued time goes
Section titled Where queued time goesTotal queued time splits into CI runtime plus three kinds of waiting:
mergify.queue.breakdown.ci_runtime.sum # running CImergify.queue.idle.capacity.sum # waiting for a free check slotmergify.queue.idle.schedule.sum # waiting for a schedule to openmergify.queue.idle.freeze.sum # waiting for a freeze to liftGraphed together as a stacked area, they show what your queue is actually
waiting on. Divide any of them by mergify.queue.idle.count for a
per-pull-request average.
Because the three idle.* metrics are pure waiting time, sum:mergify.queue.idle.*.sum
gives you total wasted time without counting CI.
Dashboards and alerts
Section titled Dashboards and alerts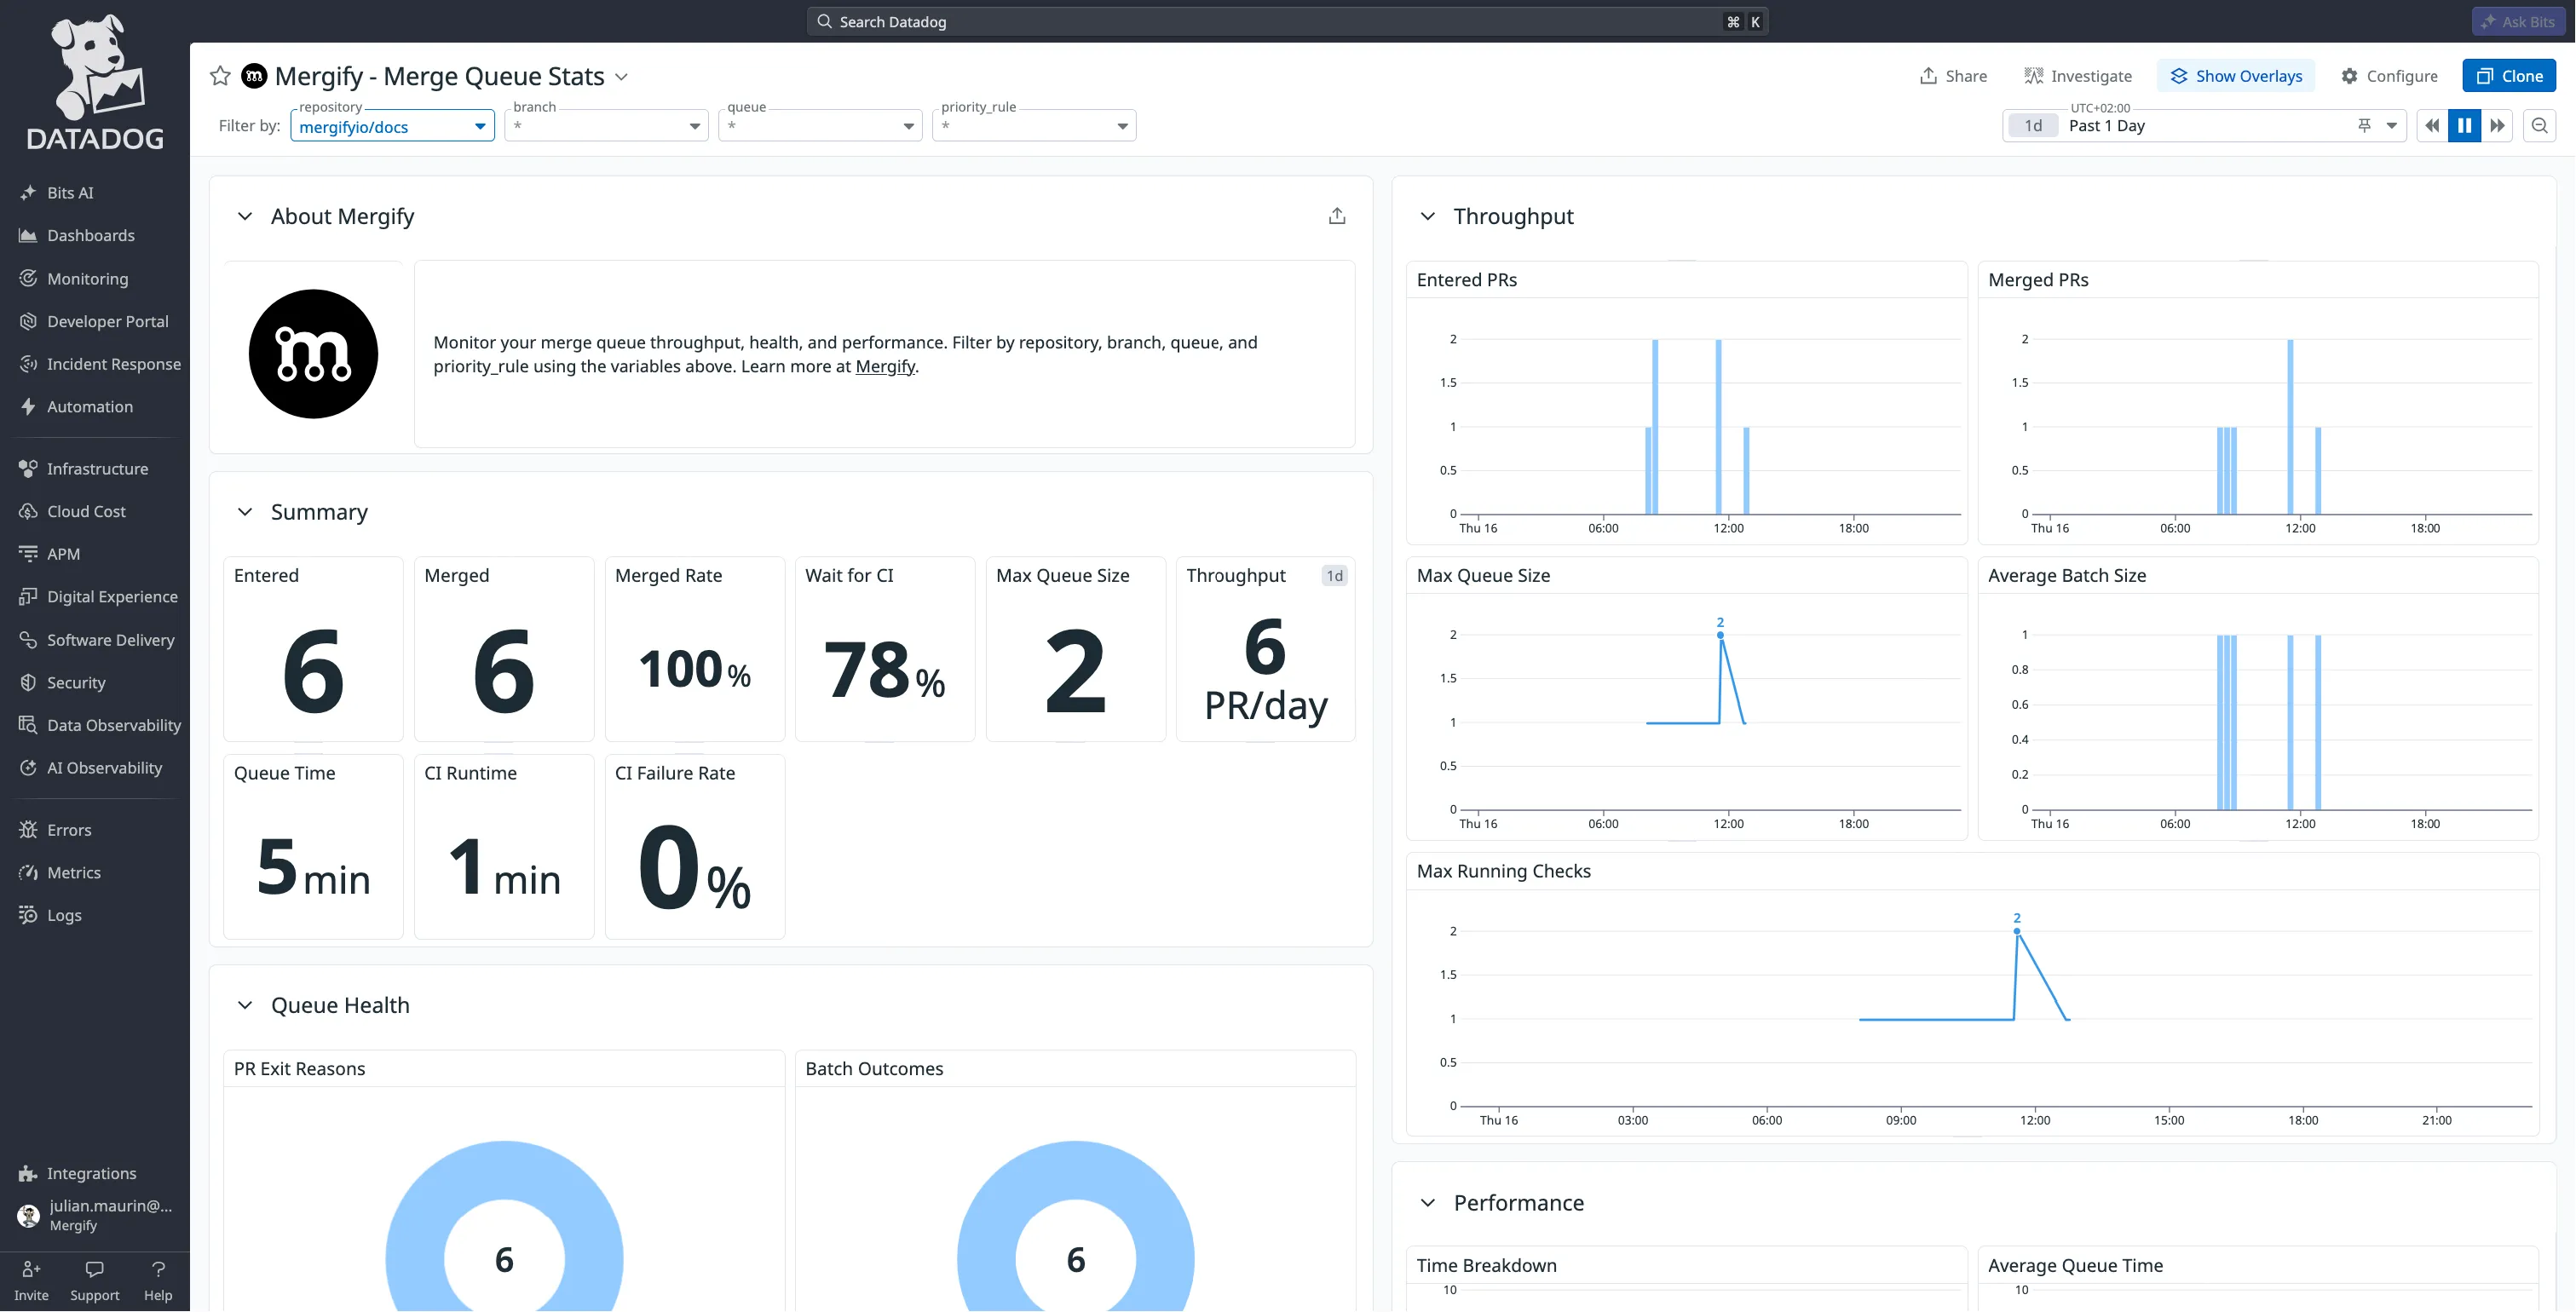
The Mergify tile ships a Mergify - Merge Queue Stats dashboard that mirrors the merge queue statistics page. In Datadog, open the Mergify integration page and find it under the Monitoring Resources tab. Clone it to adapt it to your own repositories, or build your own from the metrics above.
Since the metrics are ordinary Datadog metrics, you can alert on them with monitors. Useful ones to start with:
-
mergify.queue.size.maxstaying above a threshold, which usually means CI capacity is the bottleneck. -
Average queued time trending up week over week.
-
Check retry recovery rate dropping, which points at genuinely broken tests rather than flaky ones.
-
mergify.queue.exit_reasoncounting anything other thansuccess, which means pull requests are leaving the queue without merging.
Learn more
Section titled Learn more-
Monitoring your merge queue: what each metric means and how to read it.
-
The Mergify tile on Datadog: setup from the Datadog side and the bundled dashboard.
Was this page helpful?
Thanks for your feedback!